Android Performance: Allocation Tracker
从Memory Monitor和Heap Viewer并不能看出占用内存的对象和分配内存在代码中发生的位置,为了进一步定位内存分配,需要使用Allocation Tracker。Allocation Tracker可以记录应用的内存分配,并列出所有分配的对象和调用栈。
下面例子使用的代码可以在这里找到,运行后点击“MEMORY CHURN”,如图1所示。

图1
点击“DO INTERESTING THINGS WITH ARRAYS”后,会在主线程进行一系列耗时操作,动画会卡住,稍等片刻动画继续播放,表示耗时操作完成。
使用Memory Monitor和Heap Viewer观察按下“DO INTERESTING THINGS WITH ARRAYS”后的运行情况,如图2和图3。

图2

图3
从图2可见内存占用出现频繁快速地波动(Memory Churn),说明在短时间内申请了大量内存,然后很快被垃圾回收。从图3也可以看到垃圾回收(GCDaemon)频繁的执行。过于频繁的垃圾回收打断绘制,会导致界面卡顿(当然这里在主线程做耗时操作也会导致卡顿)。
下面使用Allocation Tracker定位频繁大量内存分配的位置。在Android Studio中点击底部的Android Monitor,打开Monitors选项卡。点击 Start Allocation Tracking,然后点击应用的“DO INTERESTING THINGS WITH ARRAYS”按钮。等待耗时操作执行完毕,点击Stop Allocation Tracking停止,Memory Monitor显示如图4所示。

图4
接着Android Studio还会自动打开一个.alloc文件,在下拉菜单选择“Group by Method”,这里以调用栈的形式显示了各个方法中分配内存的次数和大小,按照Count和Size查找频繁大量分配内存的位置,定位到MemoryChurnActivity的imPrettySureSortingIsFree()方法,方法名后面的数字是行号,如图5。
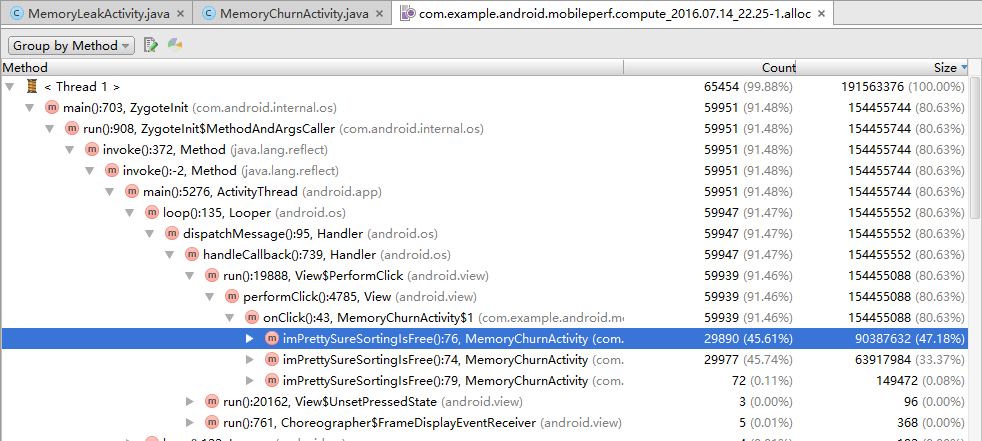
图5
在下拉菜单选择“Group by Allactor”,可以看到被频繁和大量分配的对象是AbstractStirngBuilder和String,如图6。
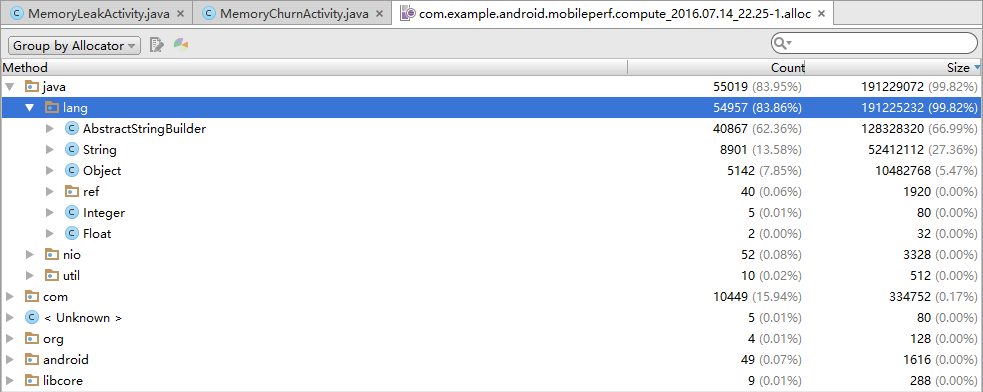
图6
找到MemoryChurnActivity.java的imPrettySureSortingIsFree():
/**
 * Sorts and prints every row of a 2D array, one element at a time.
 */
public void imPrettySureSortingIsFree() {
    // Throw together a nice, big 2D array of random numbers.
    int dimension = 300;
    int[][] lotsOfInts = new int[dimension][dimension];
    Random randomGenerator = new Random();
    for(int i = 0; i < lotsOfInts.length; i++) {
        for (int j = 0; j < lotsOfInts[i].length; j++) {
            lotsOfInts[i][j] = randomGenerator.nextInt();
        }
    }

    // Now go through and dump the sorted version of each row to output!
    for(int i = 0; i < lotsOfInts.length; i++) {
        String rowAsStr = "";
        for (int j = 0; j < lotsOfInts[i].length; j++) {
            // Clearly, the only reasonable way to construct a string is one character at a
            // time, with lots and lots of convenient concatenation.
            rowAsStr += getSorted(lotsOfInts[i])[j];
            if(j < (lotsOfInts[i].length - 1)){
                rowAsStr += ", ";
            }
        }
        Log.i("CachingActivityExercise", "Row " + i + ": " + rowAsStr);
    }
}

/**
 * Helper method, returns the sorted copy of an array.
 * @param input the unsorted array
 * @return the sorted array
 */
public int[] getSorted(int[] input) {
    int[] clone = input.clone();
    Arrays.sort(clone);
    return clone;
}
在rowAsStr += getSorted(lotsOfInts[i])[j]和rowAsStr += ", "两处在循环里直接拼接字符串导致了反复申请内存,当循环结束,反复申请的大量内存被回收,出现前面所见的Memory Churn现象。
使用StringBuilder替代字符串拼接,即可解决这一问题:
/**
 * Sorts and prints every row of a 2D array, one element at a time.
 */
public void imPrettySureSortingIsFree() {
    // Throw together a nice, big 2D array of random numbers.
    int dimension = 300;
    int[][] lotsOfInts = new int[dimension][dimension];
    Random randomGenerator = new Random();
    for(int i = 0; i < lotsOfInts.length; i++) {
        for (int j = 0; j < lotsOfInts[i].length; j++) {
            lotsOfInts[i][j] = randomGenerator.nextInt();
        }
    }

    // Now go through and dump the sorted version of each row to output! This time, use a
    // StringBuilder object so that we can construct one String per row, instead of wasting
    // String objects with ridiculous concatenation that never ends.
    // You may notice that the dancing pirate still seems to have lost the beat here. You would
    // be correct. What else could you do now to like that pirate keep his groove? What have you
    // learned?
    StringBuilder sb = new StringBuilder();
    String rowAsStr = "";
    for(int i = 0; i < lotsOfInts.length; i++) {
        sb.delete(0, rowAsStr.length()); // clear the previous row
        for (int j = 0; j < lotsOfInts[i].length; j++) {
            sb.append(getSorted(lotsOfInts[i])[j]);
            if(j < (lotsOfInts[i].length - 1)){
                sb.append(", ");
            }
        }
        rowAsStr = sb.toString();
        Log.i("CachingActivityExercise", "Row " + i + ": " + rowAsStr);
    }
}